By Bobby Franklin, REALTOR® | North Texas Market Insider™ | Legacy Realty Group – Leslie Majors Team | Waxahachie, TX | 214-228-0003 | Updated: May 2026

Here’s what most agents won’t tell you: the data from the week of May 1–8, 2026 just drew a line in the sand.
79,220 weekly pending home sales nationally. That’s not a blip. That’s not a seasonal adjustment you explain away at a cocktail party. That is a 6.7% year-over-year jump in signed contracts with buyers pulling the trigger while competitors of yours, and theirs, are still debating whether the market has “bottomed.” Per HousingWire Lead Analyst Logan Mohtashami’s weekly housing tracker, that number represents a multi-year high. And it’s happening right now, in May 2026, at the precise intersection of softening mortgage rates, decelerating inventory growth, and pent-up demand that has been building since rates hit 8% in 2023.
Here’s the argument: national pending sales are at multi-year highs, the rate environment just hit the specific threshold where buyer demand measurably strengthens, and Ellis County is outperforming the broader DFW market by double digits. All while the window of peak buyer leverage is closing faster than most people realize. Buyers who understand what that combination means right now have an advantage that will disappear in the next twelve months. Sellers who price correctly into this demand will close before summer inventory builds. Everyone else will watch from the sideline and explain away why they waited.
So let’s break it down. Not the noise. The intelligence.
Pending Sales Don’t Lie – And These Numbers Are Telling You Something

Pending sales are signed contracts. Not closings, not interest, not “I drove by a house and kind of liked it.” A pending sale is a buyer who made a decision, negotiated a price, signed a contract and put theor money at risk. That makes weekly pending data the cleanest leading indicator we have. The NAR Pending Home Sales Index was specifically designed as a forward-looking tool because contract activity historically leads closed sales by 30 to 60 days.
At multi-year highs, the interpretation isn’t complicated: buyers who sat on the sideline for two-plus years, convinced that rates would crater back to 3% if they just waited long enough, have stopped waiting. The psychology broke and when psychology breaks in one direction, it tends to get reinforced and keep breaking.
NAR’s March 2026 data confirms this isn’t a one-week anomaly. Pending home sales rose 1.5% month-over-month nationally in March, with NAR Chief Economist Lawrence Yun pointing directly to pent-up demand as the driver. The South wasn’t just keeping pace, it was leading the country. Signed contracts in the South rose 3.9% month-over-month and 2.3% year-over-year. And DFW specifically posted 8.1% year-over-year pending sale growth in March 2026 alone, placing it among the top-performing major metros in the country.
That’s not a coincidence. That’s a structural story playing out exactly the way the underlying fundamentals always said it would.
The Rate Math Everybody Is Getting Wrong

I want to stop here because this is where most real estate content goes sideways. You hear “rates are down” and you think about the headline number but that’s not where the real story lives.
The real story is in the mortgage spread, the gap between the 30-year fixed rate and the 10-year U.S. Treasury yield. This is the amount lenders require above the 10 year treasury yield. Historically, that spread averages between 1.7% and 1.8%. In practice, this would look like the treasury yield being at 4% and the Lender adding an additional 1.8% bringing your mortgage rate up to 5.8%.
In 2023, that spread blew out past 3%, which is why rates hit 8% and above even as Treasuries held relatively steady. It wasn’t Fed policy alone crushing affordability. It was a dysfunctional spread caused by lenders pricing in fear, volatility, and systemic uncertainty, which ultimately drove the real damage.
That spread has compressed back to 1.96%. That compression is the structural reason rates are staying below 7% right now, independent of whatever the Fed does or doesn’t announce at the next meeting. Freddie Mac’s PMMS reported the 30-year fixed at 6.37% as of May 7, 2026. By May 9, it had edged downwards to 6.25%.
That second number matters more than the first. Logan Mohtashami’s research identifies 6.25% as the demand inflection point aka the specific level at which buyer activity measurably strengthens. His framework: above 6.64% to 7%, demand becomes visibly suppressed, below that demand opens up. Below 6.25% is historically the sweet spot where buyers move from curious to committed. We are sitting directly on that line right now.
Current rate forecasts place the 30-year fixed between 6.1% and 6.5% through July 2026. Realtor.com’s annual forecast calls for a 6.3% average across the full year. With the spread compression holding, those forecasts have genuine structural support behind them. This isn’t rate optimism, it’s rate math.
The practical translation of that math is real money. A $342,000 loan: that’s 10% down on a $380,000 home, which sits squarely in Ellis County’s active price range. This would run you approximately $2,135 per month in principal and interest at 6.37%. At 7%, the same loan is $2,276 per month. That’s $141 a month you’re not spending. $1,692 a year you’re keeping. Over 7 years of ownership, that’s nearly $12,000 in the buyer’s pocket just from the spread compression we’ve already seen. This is not a trivial difference.
The buyers who keep waiting for 5% are gambling against a structural floor that is already in place. The buyers who act at 6.25% to 6.5% are buying into a market that has months of inventory at multi-year highs while exercising negotiating leverage that will not exist when rates make their next move down and demand surges.
Inventory Is Rising – But the Window Is Closing Faster Than You Think
National inventory hit 767,132 homes, a multi-year high. The narrative among cautious buyers has been that they have all the time in the world to find the right house. But, that narrative is getting more dangerous by the week.
Here’s what the headline doesn’t tell you: year-over-year inventory growth has decelerated from a peak near 33% in 2025 to just 1.49% now. The flood of supply that gave buyers maximum negotiating leverage through 2024 and into early 2025 is losing momentum at a significant rate. The structural reason is simple, rate lock-in. Homeowners sitting on sub-4% mortgages from 2020 and 2021 have no incentive to sell into a 6.5% rate environment. New listings came in at 80,803 for the tracked week, right in the normal seasonal range, which means no new supply shock is coming to bail out buyers who keep waiting.
For more information on the complex topic of Rate Lock-In: Vecna’s Curse: Mortgage Rate Lock-In
Realtor.com’s 2026 national forecast had projected 9% year-over-year inventory growth for the full year. That projection was almost certainly built before the spring deceleration data came in. The gap between projected and actual supply growth is the gap between the buyer’s market people were expecting and the equilibrium market we’re actually living in.
The buyers with the most negotiating power in this entire cycle were the ones who acted during peak inventory in 2024 and 2025. That window hasn’t fully closed yet, but it is narrowing faster than most people realize.
The Price Cut Story Nobody Is Reading Correctly

The share of listings with price reductions fell from 37% a year ago to 36.06%, just one percentage point, directionally. That’s not dramatic, and it shouldn’t be read as dramatic. What it tells you is where we are in the cycle: moving away from the correction dynamics of 2024 and 2025, toward equilibrium. Not back to the 2021 frenzy. Not deeper into buyer territory. Equilibrium.
Sellers who priced aggressively in late 2024, hoping to time a market recovery, had to cut. That’s what the 37% number was telling us. The market was correcting from overpricing, not from fundamental weakness. The decline to 36.06% tells us the correction is absorbing. Well-priced homes are now moving without reductions. That trend was already showing up in the Ellis County data I covered in my 2026 North Texas Housing Market Forecast. The national price cut data is now confirming it.
The implication for sellers is direct: the era of pricing 5% over and waiting for a bidding war is gone. The era of pricing at genuine market value and moving quickly is here. Sellers who understand that distinction are closing in 36 days. Sellers who don’t are sitting on that 36% list.
Purchase Applications: Ignore the Week, Watch the Year
Weekly mortgage application data is noisy by design. The 3% week-over-week dip in purchase applications for the tracked period generated some cautionary headlines. Ignore them. Weekly application data bounces constantly based on holiday weeks, lender reporting timing, and microeconomic noise that has no predictive value.
The number that matters is the 5% year-over-year gain in purchase applications. Applications lead closed sales by 30 to 90 days. A sustained year-over-year increase in applications is the machinery producing the closed sale numbers you’ll see reported in late June and July. Combined with the 79,220 weekly pending contracts, the late spring and early summer closing picture looks healthy. This market is not stalling, it’s gaining.
Ellis County: Outperforming a Market That’s Already Outperforming

While the broader DFW market posted roughly -5% home value growth in 2025 and is expected to remain flat or slightly negative through mid-2026, Ellis County came in at +7.3% year-over-year. That’s not a rounding error, that’s a 12-point divergence from the regional average. All happening in the same market, in the same rate environment, at the same time.
The reason is structural. Ellis County is one of the fastest-growing counties in Texas and in the entire United States. Between 2023 and 2024 alone, the county added 9,100 residents, a 4.1% annual population increase, driven almost entirely by domestic migration. Over the last decade, Ellis county’s total population has grown 45.9%. The 2026 estimated population sits at approximately 249,280, growing at 3.49% annually, putting Ellis among the highest sustained growth rates of any county in the state. As of May 2026 the median Ellis county household income is $99,595 and the poverty rate is just 6.9%.
People are not moving to Ellis County because they ran out of options. They are moving here because of the value equation relative to northern DFW, Austin, Denver, Phoenix, and the coastal metros. The combination of price point, land, quality of life, and access to the DFW employment engine is a calculation that keeps solving in favor of Waxahachie, Midlothian, Red Oak, Ennis, and the communities along the I-35E corridor.
That population growth is the demand floor beneath every pending sale number in this county. As I covered in my deep-dive on Waxahachie’s Minto Communities development bringing 13,000 homes to our market, the infrastructure and commercial investment following that population growth is accelerating, not plateauing. The commercial development follows the rooftops and the rooftops are still coming in large numbers.
The Ellis County Numbers Right Now
Redfin’s March 2026 data shows Ellis County median home prices up 7.3% year-over-year, with a median sale price of $429,000 and homes selling at 98% of list price. The Waxahachie median listing price is approximately $457,499, with a median sold price around $421,475 and homes going pending in roughly 36 days on average.
This is what localized market intelligence is for. The DFW average is a data point and the Ellis County fundamentals are a strategy. They are not the same thing, and treating them as the same thing is how buyers end up on the wrong side of a decision.
The North Texas Picture: A Healthy Spring That Has Legs
MetroTex’s March 2026 report showed 7,750 single-family homes sold across North Texas, a 6% year-over-year increase. Pending sales rose 3% to 8,496. Active listings increased 3% to 27,622, with months of inventory sitting at 3.8. Below the 4 to 6 months typically associated with a true buyer’s market and well below the 6+ months that signals meaningful buyer leverage.
MetroTex 2026 Chair Franceanna Campagna called it “a healthy spring market taking shape across North Texas.” With DFW pending sales up 8.1% year-over-year in March and national pending sales at multi-year highs heading into May, the spring momentum has structural support behind it. This is not seasonal noise. It is a market that absorbed a two-year correction and is now rebuilding from a legitimate demand base.
The Employment Engine Underneath All of It

Housing demand doesn’t exist in a vacuum. The reason DFW consistently outperforms national real estate trends, through rate shocks, through inventory swings, through every cycle, comes down to one major variable: jobs.
DFW captured 11 of the 164 national corporate headquarters relocations in 2025, more than any other metro in the country. That’s not a one-year anomaly. It’s the continuation of a decade-long pattern of corporate relocation, expansion, and talent migration that has made DFW one of the two or three most economically dynamic metros in North America. The companies that anchor that job growth in financial services, technology, logistics and healthcare, all pay the salaries that fund the mortgages that drive the pending sale numbers we just reviewed.
For Ellis County specifically, the employment picture is compounding. The I-35E corridor between Dallas and Waxahachie is increasingly functioning as a distribution and logistics spine for the broader DFW market, with industrial development following the residential growth northward and southward simultaneously. The people working those jobs and the people managing those companies need housing. They’e not moving to Collin County, they’re moving here.
What This Means If You’re Buying in Ellis County Right Now

The strategic read from everything above is clear: the window of maximum buyer leverage with peak inventory, elevated price cuts and minimal competition is closing. It has not closed yet, but the data trajectory is unmistakable.
If you are a buyer who has been waiting for rates to hit some imaginary number before you commit, I want you to sit with the math I laid out earlier. The difference between buying at 6.25% and buying at 5.5%(if and when that ever materializes) is meaningful on paper. But it disappears in six months of price appreciation on a home you didn’t buy. It evaporates against the competition you’ll face when 6% becomes 5.75% and every buyer who was waiting alongside you decides to move simultaneously.
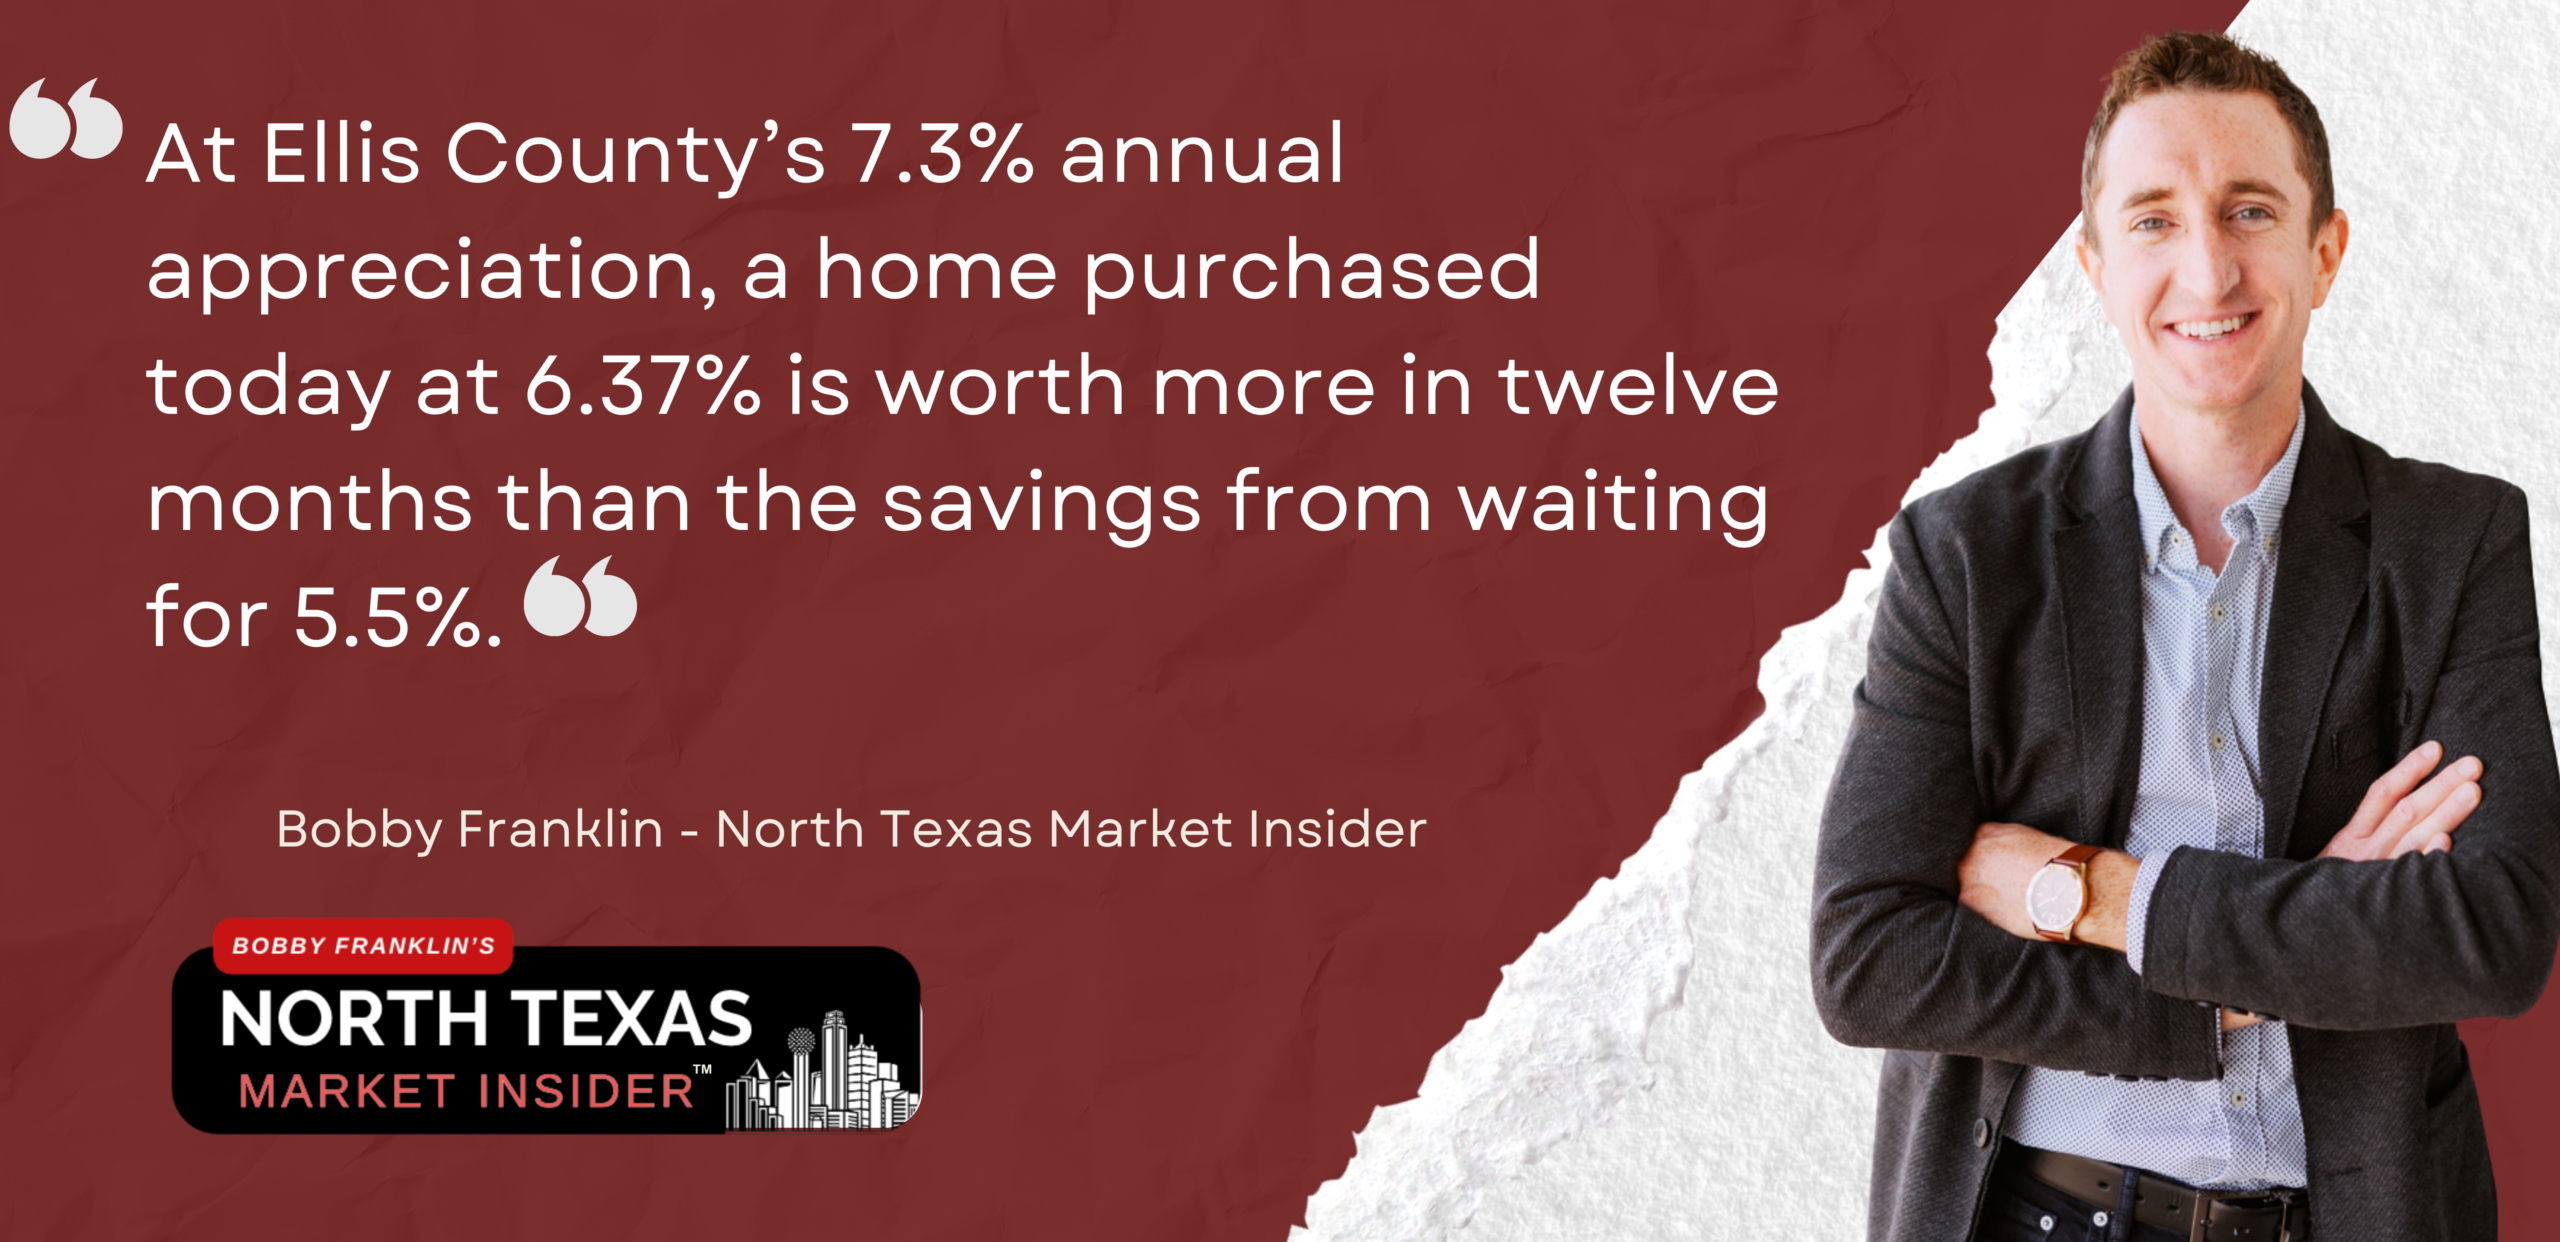
The buyers who win in this market are the ones who understand they are not buying a rate. They are buying a home, a community, a long-term asset in one of the fastest-growing counties in the United States. That’s not just pretty rhetoric, it’s math. At Ellis County’s 7.3% annual appreciation, a home purchased today at 6.37% is worth more in twelve months than the savings from waiting for 5.5%. The rate is a variable you can change after closing when rates fall. The purchase price, the lot, the location and the school district don’t change after closing.
The current environment gives you options that will not exist in 6-12 months: builder incentives on new construction are tied to rate environments, not to builder generosity. Seller concessions on resale homes from owners who priced in 2024 and need to move. Most importantly the time to make a thoughtful decision rather than a panicked one. Use that window strategically.
What This Means If You’re Selling in Ellis County Right Now

The sellers who are going to win this spring are the ones who price at or just below the market, not above it. The 98% list-to-sale price ratio is not an accident. It is the market telling you that buyers are engaged, informed, and willing to pay fair value, they’re simply not willing to subsidize overpricing.
Price your home based on what the comparable data shows, not what you need to net or what your neighbor got in 2021. Sellers who launch at 2021 pricing in a 2026 market are the ones sitting on that 36% price-cut list and after 60 days on market and a forced reduction, they net less than the seller who priced correctly on day one. Come in clean on condition. Stage or declutter so that the home’s actual square footage reads correctly. Get the conversation going now, while months of supply are still below 4, before the next wave of rate-driven demand hits and buyers have multiple options competing for their attention.
The 36-day average days on market in Waxahachie tells you the market is moving. It does not tell you that everything moves in 36 days. The homes that sit are the ones that launched at the wrong number. Don’t be that listing.
The Bottom Line: This Is the Inflection, Not the Aftermath

What I keep coming back to, looking at everything from the 79,220 weekly pending contracts to the 1.49% inventory growth deceleration to the Ellis County 7.3% year-over-year price gain, is this: we are at the inflection point, not past it.
The buyers who act in this window will look back on May 2026 the way buyers in 2013 looked back on 2012, as the moment when the data was clearly pointing toward what came next, when the prepared moved and the cautious waited. The sellers who price correctly right now will close before the summer inventory builds. The buyers who are locked in with a lender, pre-approved, and working with an agent who actually understands this market will close before the next rate move creates the next surge of competition.
The buyers who keep waiting will face that competition directly. They’ll face more buyers, less inventory, higher prices and they will have paid for the delay in the one currency that doesn’t come back: time in the market.
If you are ready to talk about what this market means for your specific situation whether it’s a move, a purchase, or a new construction decision call me directly at 214-228-0003 or schedule a consultation The conversation costs you nothing. Waiting costs you more than you think.
Ready to act on what the market is actually telling you? I work with buyers and sellers across the Ellis County corridor and greater DFW. Reach out at 214-228-0003 or northtexasmarketinsider.com.
For financing, I recommend connecting with one of my trusted lender partners. I work with all three and recommend them based on their expertise and client service. I do not receive compensation for referrals.
Andrew Bryan — miramarmortgage.com
Jennifer Nelson — eustismortgage.com
Taylor Fruge — lower.com
Bobby Franklin, REALTOR® | Legacy Realty Group – Leslie Majors Team
📲 214-228-0003 | northtexasmarketinsider.com