
Published: April 2026 | Reading Time: ~18 minutes
The Chart Going Viral on Reddit Is Real. The Panic Around It Isn’t.
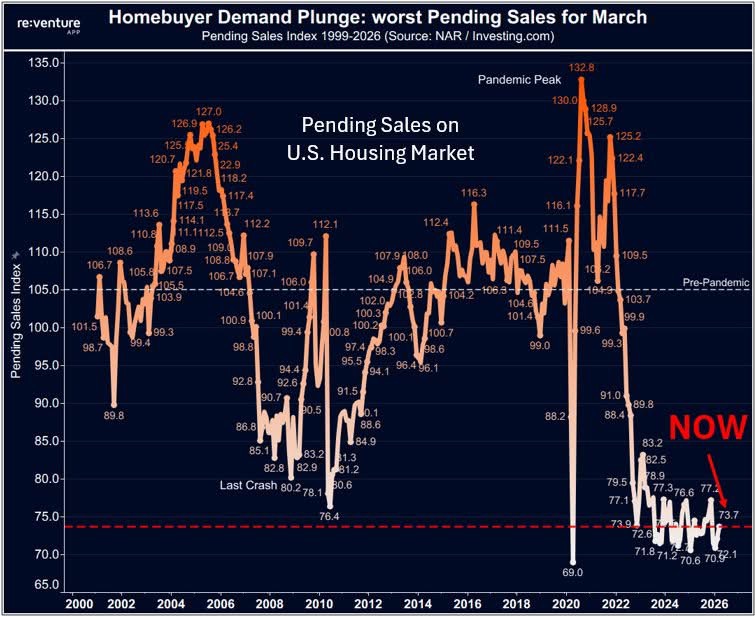
There’s a chart making the rounds on Facebook and Reddit right now that’s scaring the daylights out of homeowners across America. A red “NOW” stamp sitting at the bottom of a 25-year range. A line that looks like the housing market just walked off a cliff. Thousands of comments predicting 2008, Part Two.
Here’s the Insider take: the chart is accurate. The conclusions people are drawing from it are not.
The National Association of REALTORS® Pending Home Sales Index hit 73.7 for March 2026, the worst March reading ever recorded, lower than the depths of the 2008 mortgage crisis. That number is real. What the viral posts won’t tell you is that the same reading was up 1.5% from February 2026, beating economists’ expectations of a 0.5% gain. The year-over-year comparison looks catastrophic because the comparison base, March 2021, was a pandemic-fueled super-boom unlike anything in recorded housing history.
The market is not crashing. We are watching a market that was forcibly reset after one of the most distorted bull runs in modern real estate history.
But this data does affect your decisions. Whether you own a home in Waxahachie, Midlothian, Red Oak, Ennis, or anywhere across the Southern Dallas Corridor, ignoring this number is just as dangerous as panicking over it. So let’s break down what’s actually happening, why North Texas is a completely different story than the national headline, and what smart sellers need to do right now.

What the Pending Home Sales Index Actually Measures (And What It Doesn’t)
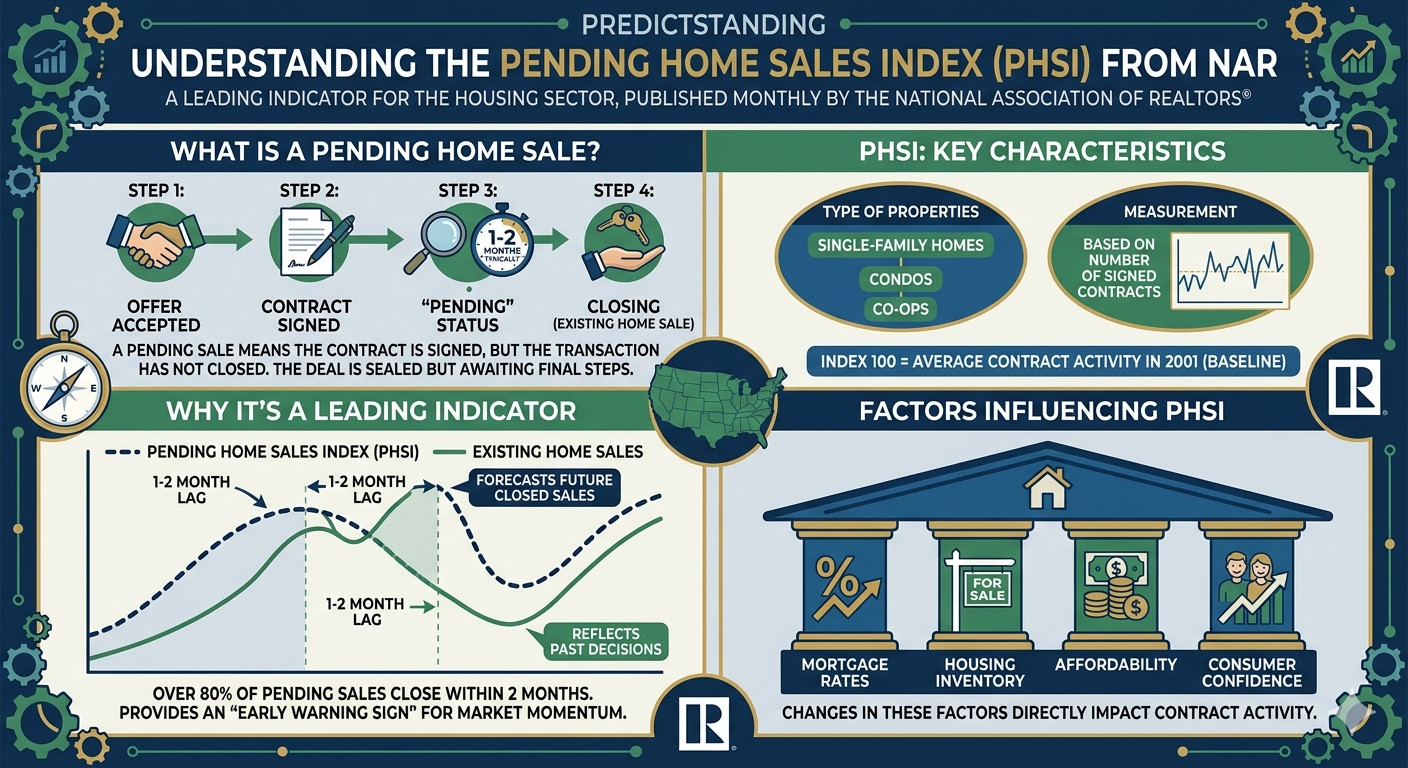
Before you can interpret a number, you need to understand what it measures. The Pending Home Sales Index is a monthly leading indicator from NAR that tracks signed real estate contracts for existing single-family homes, condos, and co-ops that haven’t yet closed. When you sign a purchase agreement, you show up in the PHSI. When that deal closes 30–60ish days later, you show up in existing-home sales.
That’s why the PHSI matters: it’s a forward-looking window into where the market is heading before it shows up in the headlines.
A reading of 100 represents the average level of contract activity in the year 2001. At 73.7 in March of 2026, we’re 26% below that 2001 baseline. For context, the absolute worst months of the 2008 mortgage crisis bottomed around 75–76. We are now technically below that floor, at least for the month of March.
Now read this part carefully, because it’s where every Reddit doom-poster goes wrong: the PHSI is not a measure of home prices. It’s not a foreclosure indicator. It’s not a signal that your home’s value is about to collapse. It is a measurement of transaction velocity, how quickly buyers are moving from browsing to signing. When velocity slows, it tells us about buyer hesitation. It does not tell us about the underlying value of the real estate itself.
“The Pending Home Sales Index is a leading indicator of future existing-home sales. It measures housing contract activity, and is based on signed real estate contracts for existing single-family homes, condos and co-ops.” — National Association of REALTORS®
Five Forces Behind the Record-Low March Reading
Understanding why a number landed where it landed is the difference between a smart real estate decision and a fear-based one. The March 2026 reading is the product of five interconnected forces that have been building for three straight years.
1. Affordability Hit a Breaking Point
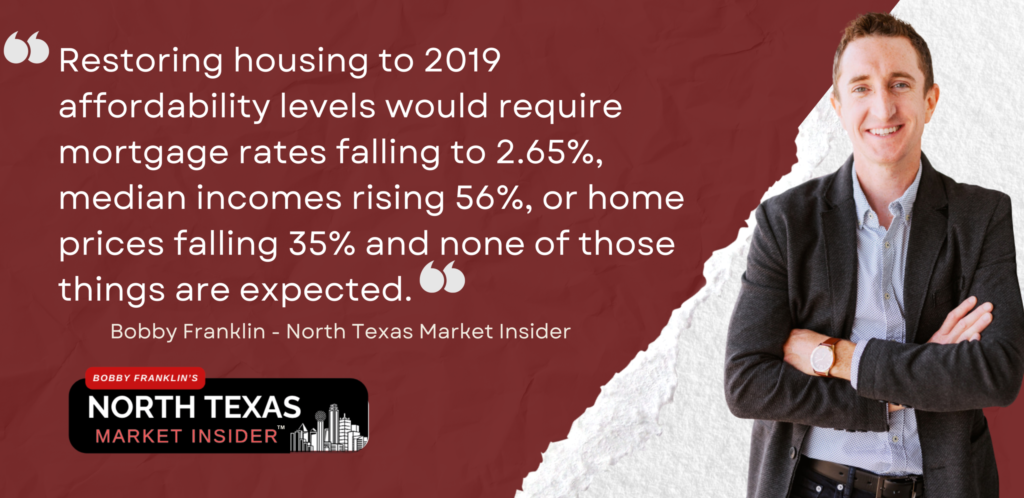
The core problem is math. Realtor.com’s affordability research lays it out plainly: restoring housing to 2019 affordability levels would require mortgage rates falling to 2.65%, median incomes rising 56%, or home prices falling 35% and none of those things are expected. A mortgage payment on a typical U.S. home now eats roughly 30–35% of median household income, well above the 28% threshold traditionally considered the limit of healthy housing expense. Zillow’s analysis confirms housing costs consume 35.3% of median household income at 20% down. The squeeze is real.
2. Mortgage Rates Stayed Elevated
After peaking near 8% in late 2023, the 30-year fixed has come down, but not nearly enough to restore pandemic-era affordability. The National Association of Home Builders projects rates to remain slightly above 6% through most of 2026, with the Federal Reserve expected to make only modest additional cuts. At 6–6.5% on a $400,000 loan, you’re looking at a monthly payment in the $2,400–$2,600 range, which simply doesn’t work for many would-be buyers at current income levels.
3. The Rate Lock-In Effect Is Still Freezing Inventory
Roughly 60% of existing U.S. homeowners hold mortgages below 4%. Trading that mortgage for a 6.5% one means $800–$1,200 more per month for a comparable home. So millions of move-up sellers are frozen in place. This keeps inventory tight, keeps prices elevated and further discourages buyers. It’s a catch-22 that has defined the market since 2022.
4. Economic Uncertainty Is Driving Hesitation
NAR Chief Economist Lawrence Yun put it directly: lower consumer confidence and softer job growth are holding buyers back heading into spring 2026. Trade policy uncertainty, tariff announcements, and financial market volatility compound that hesitation. Especially among first-time buyers already stretched thin. None of this is permanent, but ALL of it is real right now.
5. The Pandemic Comparison Base Is Statistical Theater
Here’s the part the viral charts conveniently leave out: the 2020–2021 housing boom was a once-in-a-century anomaly driven by near-zero rates, massive fiscal stimulus, and a generational shift to remote work. Comparing today’s market to those peak conditions is like comparing normal holiday travel to the year everyone drove instead of flew during COVID. The baseline is so distorted that every “year-over-year” comparison looks catastrophic even when the underlying market is fundamentally healthy. NAR’s own March 2026 report showed a month-over-month increase of 1.5%, beating Wall Street expectations. You won’t find that detail in the doom-posts.
Is This 2008 All Over Again? No. And Here’s Why That Matters.

Every viral housing chart triggers the same Facebook and Reddit reflex: this is 2008. AGAIN. I understand why they feel that way. The 2008 crash carved deep psychological scars into an entire generation. But the structural conditions driving the current slowdown are fundamentally different from what caused the 2008 collapse, and conflating the two is one of the most expensive mistakes a homeowner can make right now.
| Factor | 2008 Crisis | 2026 Reality |
|---|---|---|
| Loan Quality | Subprime, NINJA, no-doc loans dominated; ~20% of originations were subprime | Less than 1% subprime; strict Qualified Mortgage standards with documented income and capped DTI |
| Borrower Credit | Median FICO often below 700; widespread stated-income fraud | Median FICO 739–770 — historically prime borrowers |
| Supply vs. Demand | Massive overbuilding created an enormous supply glut | Housing supply approximately 12% below pre-pandemic norms nationally |
| Homeowner Equity | Many homeowners underwater; negative equity triggered foreclosure waves | U.S. homeowners collectively hold near-record equity; forced sales minimal |
| Foreclosure Risk | Flood of foreclosures created distressed inventory glut | Foreclosure rates near historic lows; homeowners can sell at market value |
| Unemployment | Spiked above 10%; mass job losses triggered forced sales | Labor market remains historically healthy despite some softening |
According to Newsweek’s March 2026 housing analysis, experts across Zillow, Realtor.com, and the leading economic forecasters are projecting a rebalancing and modest growth scenario, not a nationwide collapse. Consensus puts 2026 home price growth between 1.3% and 3.5%, with NAR projecting 4% nationally.
The bottom line: this is a demand-side affordability correction, not a credit-quality collapse. Some markets are pricing below their 2021–2022 peaks, but that’s a correction from a historically anomalous bubble, not a fundamental breakdown in housing values. That distinction is the entire ballgame. It determines whether you make decisions from strategy or from fear.
North Texas Is a Completely Different Story Than the National Headline

While national housing data is a useful compass, it’s also a terrible map. If you’re making decisions about a specific market, you need specific data about that specific market. The data for the DFW Metroplex, and Ellis County in particular, tells a story the viral charts will never tell.
North Texas in March 2026: Sales Are Actually Up
While national pending sales were hitting historic lows, MetroTex reported 7,750 single-family homes sold in North Texas in March 2026, a 6% increase over March 2025. Total dollar volume reached $3.89 billion, up 5% year-over-year. Pending sales rose 3% to 8,496 contracts.
Those are not the statistics of a crashing market. Those are the statistics of a market that’s normalizing after three years of affordability-driven paralysis.
Yes, the average home price ticked down 1% to $502,255 and the median fell 3% to $388,495. Days on market rose 11% to 71 days. But read those numbers correctly: prices are adjusting to meet buyers, not collapsing under their weight. The sale-to-list price ratio averaged 94.7%, meaning sellers are getting within 5.3% of asking price. That is nowhere near the double-digit discounts you’d see in a real market collapse.
DFW Is Still the #1 Market in the Country
For the second consecutive year, PwC’s Emerging Trends in Real Estate report ranked Dallas-Fort Worth as the #1 market to watch for overall investment and development prospects. That is not a coincidence. DFW combines the strongest job growth in Texas with one of the most diversified economies in the country covering major centers of finance, healthcare, technology, logistics, manufacturing, and energy. Unlike Austin (heavily tech-dependent) or Houston (energy-dependent), DFW has the structural resilience to absorb sector-specific downturns. MetroTex confirms the market is transitioning from a frenzied seller’s market into a more balanced, but fundamentally strong, environment.
Ellis County: The Strategic Opportunity Almost Nobody Is Talking About
If national data is a compass and DFW data is a map, Ellis County data is your GPS coordinates. Here’s what the early-2026 Realtor.com Ellis County market data actually shows:
- Median listing price: $453,990 (median sold price $406,598)
- Active listings: 3,298 — up 7.5% year-over-year, giving buyers more choices
- Median days on market: 52 days, down 10.34% year-over-year — homes are moving faster than last year
- Price per square foot: $192
- Waxahachie median listing: $457,499 at $195/sq ft
In Waxahachie specifically, Zillow shows the average home value at $370,257, with homes going pending in roughly 57 days. Prices are down 2.2% over the past year — a healthy correction from pandemic-era highs, not a structural collapse. And per OnDemand DFW’s Ellis County update, county-wide prices are running modest appreciation of approximately 4.0% annually in early 2026, supported by strong in-migration and the area’s position in the I-35E growth corridor.
For deeper, city-by-city intelligence on what’s happening in your specific community, dig into these market reports:
- Waxahachie Real Estate Market Intelligence — North Texas Market Insider
- Midlothian Real Estate Market Intelligence — North Texas Market Insider
- Red Oak Real Estate Market Intelligence — North Texas Market Insider
- Mansfield Real Estate Market Intelligence — North Texas Market Insider
- Glenn Heights Real Estate Market Intelligence — North Texas Market Insider
What a Record-Low PHSI Actually Means If You’re Selling a Home in North Texas

If you own a home in Ellis County, the DFW Metroplex, or anywhere in the communities we serve across North Texas, here is the honest assessment of what this data means for your sale.
Strategy Beats Timing – Every Single Time
The era of “list it and they will come at any price” ended in mid-2022. Buyers in 2026 are not desperate. They have 27,622 active listings to choose from in North Texas as of March 2026, which is nearly four months of supply. Homes that are overpriced relative to comps are sitting 70+ days and frequently requiring two or three price reductions. That sequence of overpriced listing, extended days on market, price cut, yet another price cut… signals distress to buyers and usually ends in a final sale price lower than what an accurate price would have produced from day one.
The homes selling fast in this market are the ones priced at or just below current market value, professionally photographed, decluttered or staged, and marketed with actual strategy. That’s not complicated. But it requires an agent who understands the current market, not the market of 2021.
Your Equity Position Is Likely Stronger Than You Think
If you bought before 2022, you almost certainly built substantial equity even after the correction. The median home price in North Texas appreciated roughly 45% between 2019 and 2023. Even accounting for the 3–5% softening through 2025–2026, most pre-2022 buyers are sitting on six-figure equity positions. That equity is real, it is liquid, and for many homeowners it represents the largest single asset they own. Our recent analysis of what’s actually happening in the North Texas market lays out why right now may still be a strategically advantageous moment to list, even in a slower environment.
Buyers Are Selective — Not Absent
Here’s what 73.7 doesn’t tell you: buyers are still buying. North Texas closed 7,750 sales in March 2026 which is up 6% over March 2025. Today’s buyers are simply more discerning. They’re running the numbers more carefully, demanding inspections, negotiating repairs, walking away from homes that don’t measure up. That is healthy market behavior, and it rewards sellers who price honestly and present professionally from day one.
Inventory Is Rising – Which Creates Urgency for Sellers, Not Buyers
Active North Texas listings rose 3% in March 2026 to 27,622 homes, and Zillow projects national inventory to climb another 8.9% year-over-year through 2026. More inventory means more competition for your listing. Sellers who list now, before the market is fully saturated, hold a meaningful advantage over those waiting for conditions they perceive as “better.” By the time conditions feel better, the competitive landscape will already have shifted against you.
According to analysis of the DFW seasonal listing cycle, mid-April through late May is the optimal listing window for 2026 providing the best combination of buyer intent, pricing stability, and competitive conditions. If you’re reading this in late spring, you’re still inside the prime window.
Mortgage Rates in 2026: The Honest Picture for North Texas
Mortgage rates are the single greatest driver of homebuyer demand in this market, so let’s address them directly. Here’s where the leading forecasters stand as of spring 2026:
- Realtor.com: 6.3% average for 2026
- Redfin: 6.3% average for 2026
- NAR: Trending toward 6.0% by year-end
- NAHB: Slightly above 6%, with two projected Fed cuts of 25 basis points each
- Freddie Mac / CNBC consensus: 5.90%–6.30% by year-end 2026
NAHB’s 2026 outlook noted that the 30-year fixed dropped 13 basis points to 6.2% in a single session following Fannie Mae and Freddie Mac’s announcement of $200 billion in mortgage-backed securities buybacks. Proof that institutional interventions can move rates meaningfully in short windows.
For sellers, the rate environment matters because it directly defines your buyer pool. At 6.5%, qualifying for a $400,000 home requires a household income of roughly $90,000–$100,000. At 6.0%, that threshold drops several thousand dollars, which expands your buyer pool by millions of households nationally.
The takeaway: waiting for rates to drop to 5% before listing is a losing strategy. If and when rates hit that level, every seller who’s been waiting will rush to market simultaneously. You’ll have more competition, not less. The sellers who win in a rate-declining environment are the ones already under contract before the flood arrives. Our detailed analysis of how interest rate changes affect purchasing power in North Texas breaks these dynamics down at every price point.
Understanding the NAR Settlement: What Sellers and Buyers Must Know in 2026

No honest discussion of today’s market is complete without addressing the NAR $418 million settlement that took effect August 17, 2024. It fundamentally changed how buyer-agent compensation is handled, and misunderstanding it is costing both buyers and sellers money right now.
What Changed
- No MLS commission offers: Listing agents can no longer specify buyer-agent compensation on the MLS
- Mandatory buyer agreements: Buyers must sign a written representation agreement outlining compensation before touring homes
- Negotiated compensation: Buyer-agent compensation is now negotiated separately and can be included as part of the offer terms
- Full commission flexibility: All commissions are negotiable. There is no standard, fixed, or required rate
What Did Not Change
Despite predictions of dramatic industry upheaval, post-settlement data shows commission rates have barely budged. Most sellers in competitive markets are still choosing to offer compensation to buyer agents as part of their overall negotiation strategy, because doing so typically results in a larger, more competitive buyer pool and faster sales. The practice is now contractual rather than assumed, which actually increases transparency for everyone.
As a North Texas seller, you have more flexibility than ever before to negotiate the terms of your representation. What matters most is working with an agent who clearly explains their services, delivers measurable results, and operates with full transparency under the updated rules. All compensation arrangements through the Leslie Majors Team are fully disclosed, negotiated in writing, and never tied to steering or fixed-rate requirements. Our fiduciary duty is to you, the client, always.
Why People Are Still Moving to North Texas – Even With “Record-Low” National Demand

Here is the paradox the viral charts miss completely: even as national homebuyer demand hits record lows, people are still moving to Dallas-Fort Worth in serious numbers. AP News reported that 2025 home sales nationally were at a 30-year low and yet DFW continued to be one of the top destination metros for domestic migration.
That distinction matters. National data measures broad consumer sentiment. Local migration data measures actual household formation decisions. They are not the same thing.
Corporate relocations, remote work flexibility, Texas’s zero state income tax, and relative affordability compared to coastal markets continue to push a steady flow of buyers into North Texas from California, New York, Utah, and the rest of the high-cost states. Our full North Texas Relocation Resource Hub documents why families moving from out of state are saving $2,000–$4,000 per month by relocating to Ellis County.
For sellers, that’s the entire game. Your buyer may be a California executive who just sold an 1,800-square-foot Bay Area home for over $1 million and is looking at your 3,000-square-foot Waxahachie home for $450,000 with eyes wide open. Understanding who your buyers are and marketing to them effectively is the difference between 45 days on market and 90.
We also keep close tabs on the development catalysts reshaping the region’s long-term value trajectory. The Landmark by Hillwood $10 billion master-planned community and the transformational infrastructure investment running across the I-35E corridor are creating appreciation tailwinds that extend well beyond today’s PHSI numbers.
“Is Now a Good Time to Sell My House in North Texas?” – The Evidence-Based Answer

This is the most-searched question among North Texas homeowners right now, and it deserves a straight answer instead of a sales pitch.
It May Be Time To Sell If Any of These Apply to You
- You purchased before 2022 and built substantial equity -That equity is your strongest financial lever, and waiting for a “better market” while paying carrying costs slowly erodes it.
- Life circumstances are driving the decision – job relocation, family growth, divorce, estate settlement, retirement. Life timing almost always trumps market timing.
- You’re moving to a destination market with high inventory – If your destination has overbuilt (parts of Austin, Phoenix, or coastal metros), you may benefit from buyer leverage on both sides of the transaction simultaneously.
- You own in a high-demand North Texas submarket – parts of Ellis County, particularly along the I-35E corridor, are still seeing genuine buyer competition for well-priced, well-presented homes. March 2026 confirmed pending sales rose 3% in North Texas even as national pending sales hit historic lows.
What Separates Sellers Who Win From Sellers Who Don’t
In 2026, the gap between a home that sells in 30 days at asking and one that sits 90 days requiring three price cuts comes down to five factors: pricing accuracy, presentation quality, marketing reach, agent expertise, and negotiation skill. None of these can be taken for granted in this market. Homes overpriced by even 3–5% are getting passed over by buyers running careful affordability math on every property they tour. Homes professionally photographed and marketed to the relocation buyer pool consistently outperform homes marketed only to local buyers. For a data-driven walkthrough of what winning actually looks like in today’s environment, read our comprehensive How to Negotiate the Best Deal in the 2025–2026 North Texas Market.
The Affordability Reset Is Quietly Working in Sellers’ Favor
One development that’s not getting enough airtime: NAHB reports the Housing Affordability Index rose more than 11% year-over-year in North Texas, and NAR projects a 4% increase in national home sales for 2026. Buyers who were sidelined by 2023–2024 affordability conditions are re-entering the market as wages start to slightly outpace modest home price growth for the first time since the pandemic. The window between “conditions improving” and “competition flooding back in” is exactly the window strategic sellers are targeting right now.
Buyers: What Record-Low Demand Means for You
If low pending sales sound like bad news for sellers, they sound like opportunity for buyers and you’re right, with a few important caveats. For North Texas buyers, the current market offers conditions that simply did not exist between 2020 and 2023:
- More inventory, more choices. 27,622 active North Texas listings means you have genuine optionality for the first time in years. You can tour multiple homes, take time to decide, and still find what you’re looking for.
- Negotiating leverage. A 94.7% sale-to-list ratio means buyers are successfully negotiating meaningful discounts off asking. Inspection contingencies and financing contingencies are being accepted regularly again.
- Seller concessions. Sellers are frequently contributing 2–3% toward closing costs, buydown points, or repairs. All resources that effectively lower your total cost of ownership.
- Less competition. The bidding war environment of 2021–2022 has largely dissipated in most price ranges, so buyers can actually evaluate homes calmly instead of making panicked decisions with money they can’t afford to lose.
The strategic move for qualified, ready buyers is to act before the anticipated second-half rate declines bring a wave of competition back into the market.
Where North Texas Is Headed Through the Rest of 2026

A record-low March PHSI is one data point in a much larger narrative. Here’s the consensus view from the most authoritative sources on where North Texas real estate is heading through the rest of 2026:
- Price trajectory: Modest appreciation of 1.8%–4% in DFW, with Ellis County showing a stronger 3–5% range in select submarkets. The 45% pandemic surge will not repeat and prices are not collapsing.
- Sales volume: NAR projects 4% increase in national home sales for 2026; North Texas is already running ahead of last year with March up 6%.
- Inventory: Active listings will keep rising through mid-2026, giving buyers more options but creating a more competitive environment for sellers as the year progresses.
- Mortgage rates: Most likely to stay in the 6%–6.5% range with potential dips toward 5.75%–6.0% in the second half if the Fed executes its projected two cuts.
- Market balance: North Texas is moving toward 4.0+ months of supply, the technical definition of a balanced market. That is healthy, not alarming. Texas Secure Title’s 2025 recap and 2026 outlook confirms the trajectory with detailed county-by-county data.
The wildcard in any forecast is macroeconomic factors like tariff policy, Fed decisions, employment trends and geopolitical events. Those move the needle in ways no data model can fully anticipate. What stays consistent regardless of those variables is North Texas’s structural foundation: population growth, corporate relocations, economic diversification, and relative affordability. That combination puts a durable floor under local real estate values that most other markets simply do not have.
The 10 Most-Googled Housing Market Questions Right Now

These are the questions actually showing up in Google Trends, Reddit search data, and our own client inbox. All answers reflect verified data as of April 2026.
1. Is the housing market going to crash in 2026?
No. Not according to NAR, Zillow, Redfin, Realtor.com, Fannie Mae, or the Mortgage Bankers Association. None of them are projecting a crash in 2026. Forecasters consistently project modest home price growth of 1.3%–4%, not the kind of collapse that would constitute a crash. The differences from 2008 are structural: historically high borrower credit quality, near-record homeowner equity, limited distressed inventory, and a housing shortage, not an oversupply. This is a demand-side affordability correction, not a credit or supply crisis.
2. Should I sell my house now or wait until 2027 in North Texas?
For most North Texas homeowners who bought before 2022, the current equity position makes a strategic sale highly viable. Waiting for dramatically better conditions is a gamble: inventory is rising (your competition increases over time), and the buyers most motivated and least price-sensitive are active right now. Homes priced accurately and presented professionally are still selling, just not instantly and usually not above asking. The right answer depends on your equity position, your destination, and your life circumstances, which is exactly why we offer complimentary, no-obligation seller consultations.
3. Will mortgage rates go down in 2026?
Modestly, yes. NAHB projects two Fed rate cuts in 2026, each 25 basis points, which could push 30-year fixed rates toward 5.75%–6.0% by year-end. A return to pandemic-era 2.5%–3.5% rates is not anticipated. For context, mortgage rates averaged roughly 6.3% from 1990–2020 — meaning today’s rates are historically normal. They just feel high because most people are anchored to anomalous pandemic lows.
4. What is the Pending Home Sales Index, and what does a reading of 73.7 mean?
The PHSI measures homes under signed contract but not yet closed. A baseline of 100 represents 2001 contract activity. At 73.7, March 2026 is roughly 26% below that baseline, reflecting significantly reduced buyer activity vs. early-2000s averages. Crucially, the reading was up 1.5% from February 2026, beating economists’ expectations. The low absolute level reflects accumulated impact from high mortgage rates and affordability challenges, not imminent market collapse.
5. Is North Texas a buyer’s market or a seller’s market in 2026?
North Texas is transitioning toward a balanced market, with inventory at roughly 3.8 months of supply as of March 2026, approaching the 4–6 month range economists consider balanced. In this environment, neither side holds overwhelming leverage. Well-priced, well-presented homes in high-demand submarkets like the I-35E Ellis County corridor still attract serious buyer attention and sell within 30–60 days. Overpriced homes face genuine market resistance that simply did not exist in 2021–2022.
6. How much do I need for a down payment to buy a house in North Texas in 2026?
The conventional 20%-down expectation is not required for most buyers. FHA loans allow 3.5% down with qualifying credit scores. Conventional loans start at 3–5% down. VA and USDA loans offer zero-down options for qualifying buyers. Multiple Texas state programs offer down payment assistance for first-time buyers. On a $325,000 home with an FHA loan, total cash requirements including closing costs (after seller concessions) can land as low as $15,000–$20,000.
7. Why are homes sitting on the market longer in 2026?
Median days on market in North Texas rose to 71 days in March 2026, up 11% year-over-year, for two reasons. 1. Affordability constraints are making buyers more deliberate and selective, and rising inventory is giving buyers more alternatives, which reduces urgency. In a healthy market, 60–90 days on market is entirely normal. The 2021–2022 era of 5–10 day sales was the anomaly, not the standard. Homes priced at fair market value with strong presentation are still selling considerably faster than the market average.
8. Is it better to buy a home now or wait for prices to drop in North Texas?
Waiting for significant price declines in North Texas is a risky strategy. DFW price forecasts project modest appreciation or flat conditions through mid-2026, then a gradual return to 2–4% annual gains. The structural factors supporting North Texas prices — population growth, job creation, corporate relocations, relative affordability — are not going away. For buyers, the cost of waiting includes ongoing rent payments, rising competition as rates decline, and the loss of equity-building months. Our analysis of housing affordability in 2026 explores this tradeoff in full.
9. What is the difference between pending home sales and existing home sales?
Pending home sales (tracked by the PHSI) measure homes where a purchase contract has been signed but the transaction has not yet closed. A home goes “pending” when the seller accepts an offer and contingencies are cleared. Existing home sales (tracked separately by NAR) measure completed transaction, meaning the deed has transferred and keys have changed hands. Because closings typically take 30–60 days after signing, the PHSI is a leading indicator that tells you where existing home sales will be roughly 60 days from now.
10. How do I find the best real estate agent in North Texas in 2026?
In the post-NAR-settlement environment, choosing an agent requires more due diligence than before. Look for: (1) verifiable local market knowledge specific to your submarket, not just DFW broadly; (2) data-driven pricing strategy backed by current comps, not wishful thinking; (3) transparent written agreements that clearly explain services and compensation; (4) demonstrated marketing capability including professional photography, digital advertising, and relocation buyer outreach; and (5) a current track record of results in the 2025–2026 market. The Leslie Majors Team at Legacy Realty Group consistently ranks among the top producers in Ellis County and serves buyers and sellers across the entire Southern DFW corridor.
Ready to Make a Smart Real Estate Decision in This North Texas Market?

The viral chart showing U.S. homebuyer demand at a record low is real. The panic it’s generating across Reddit and social media is, in most cases, not warranted. At least not for homeowners and buyers in North Texas. Our market is outperforming national trends, our fundamentals are sound, and for sellers and buyers who approach today’s conditions with strategy instead of emotion, meaningful opportunities exist right now.
Whether you’re considering selling your home in Waxahachie, exploring a relocation to Ellis County, or just trying to understand what these national headlines mean for your specific situation, I’m here to give you the straight, data-backed answer, not the answer that sounds good, but the answer that actually serves your financial interests.
For mortgage strategy and pre-approval, my three trusted lender partners are Denise Donoghue (The Mortgage Nerd) , Andrew Bryan (Miramar Mortgage) and Ethan Hester (Midtex Mortgage). Tell them I sent you.
All real estate services are provided in full compliance with the Fair Housing Act, RESPA, Texas Real Estate Commission advertising regulations, and the NAR Code of Ethics. Commission arrangements are negotiable, transparent, and fully disclosed in writing at all times. No consumer is ever steered based on protected class status or commission considerations. Equal Housing Opportunity.


Bobby Franklin, REALTOR® | Legacy Realty Group – Leslie Majors Team | 214-228-0003 | northtexasmarketinsider.com
Serving Ellis County, Johnson County, Hill County, and the greater DFW Metroplex.