Fort Worth Area

Fort Worth Skyline

Find The Right Corner Of Fort Worth

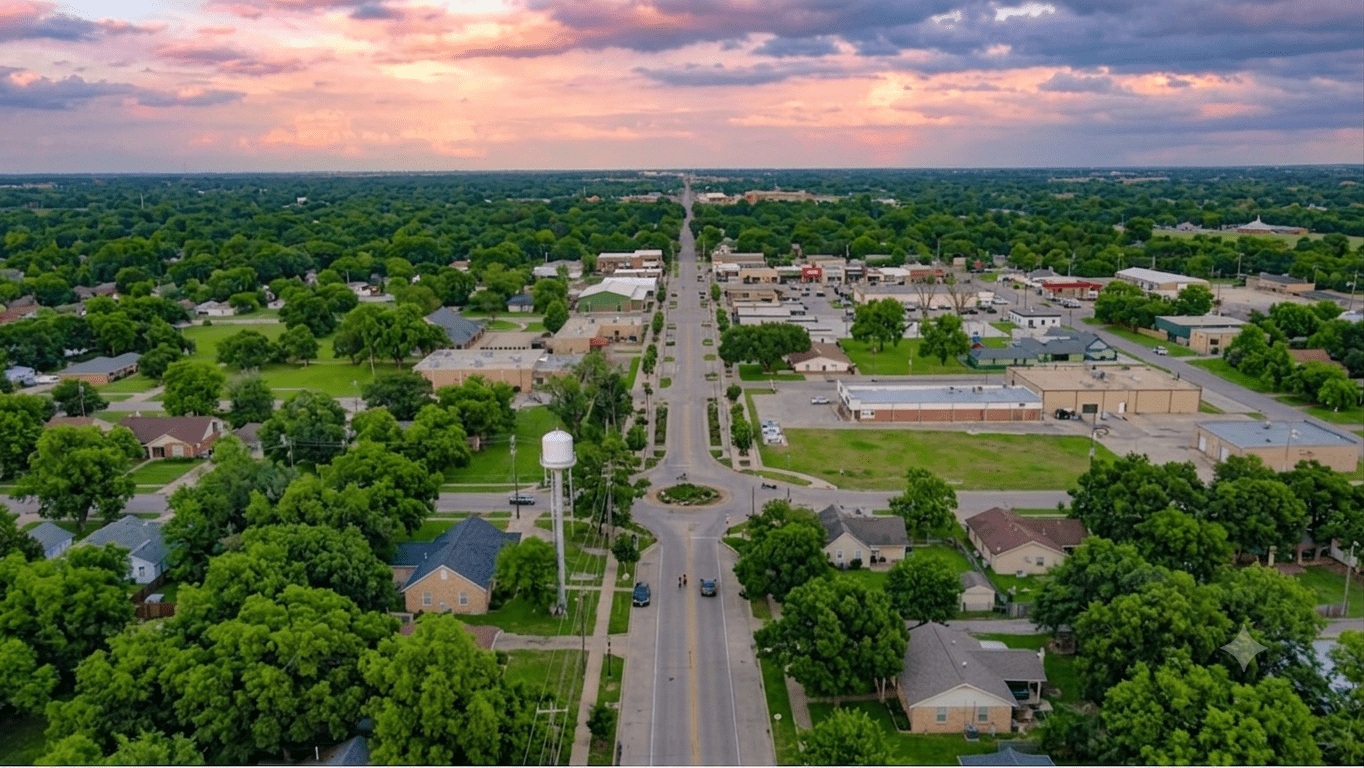
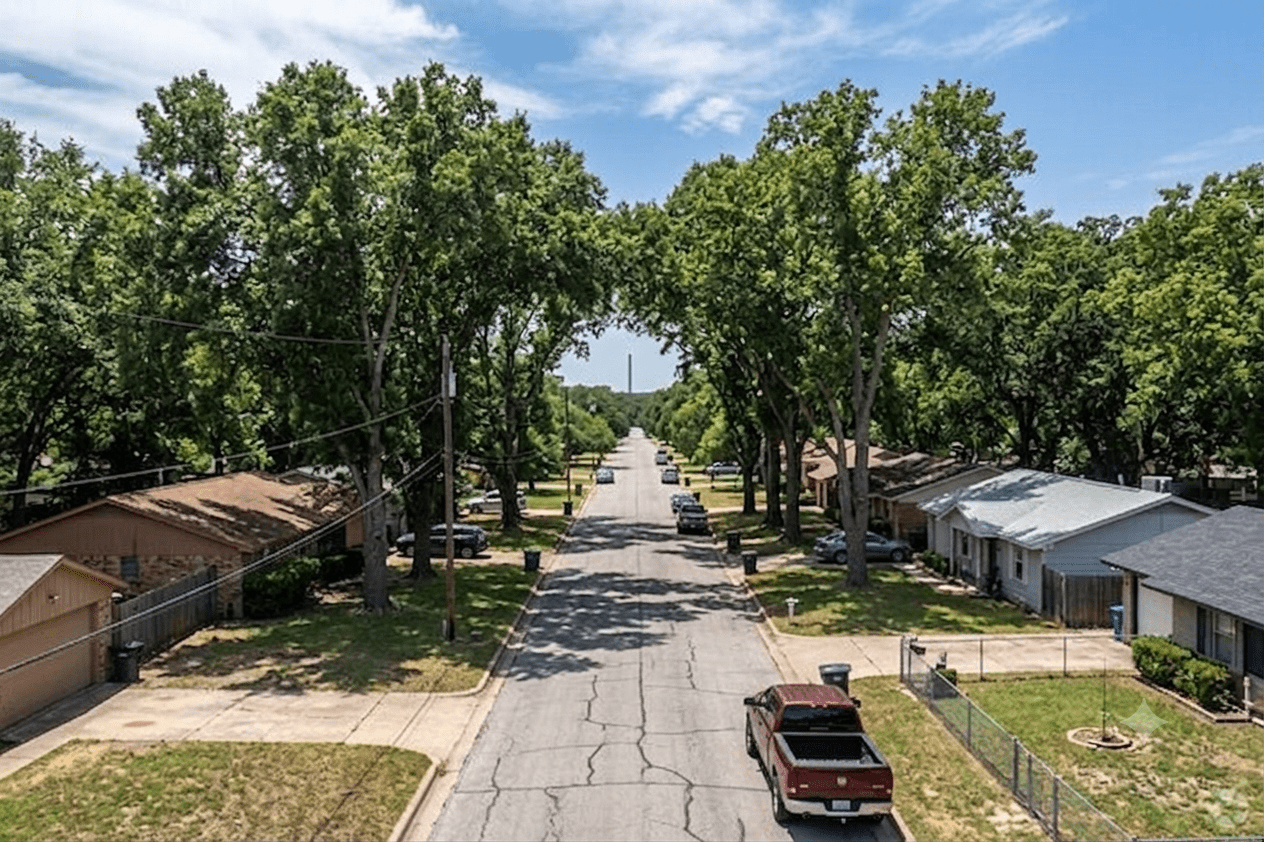
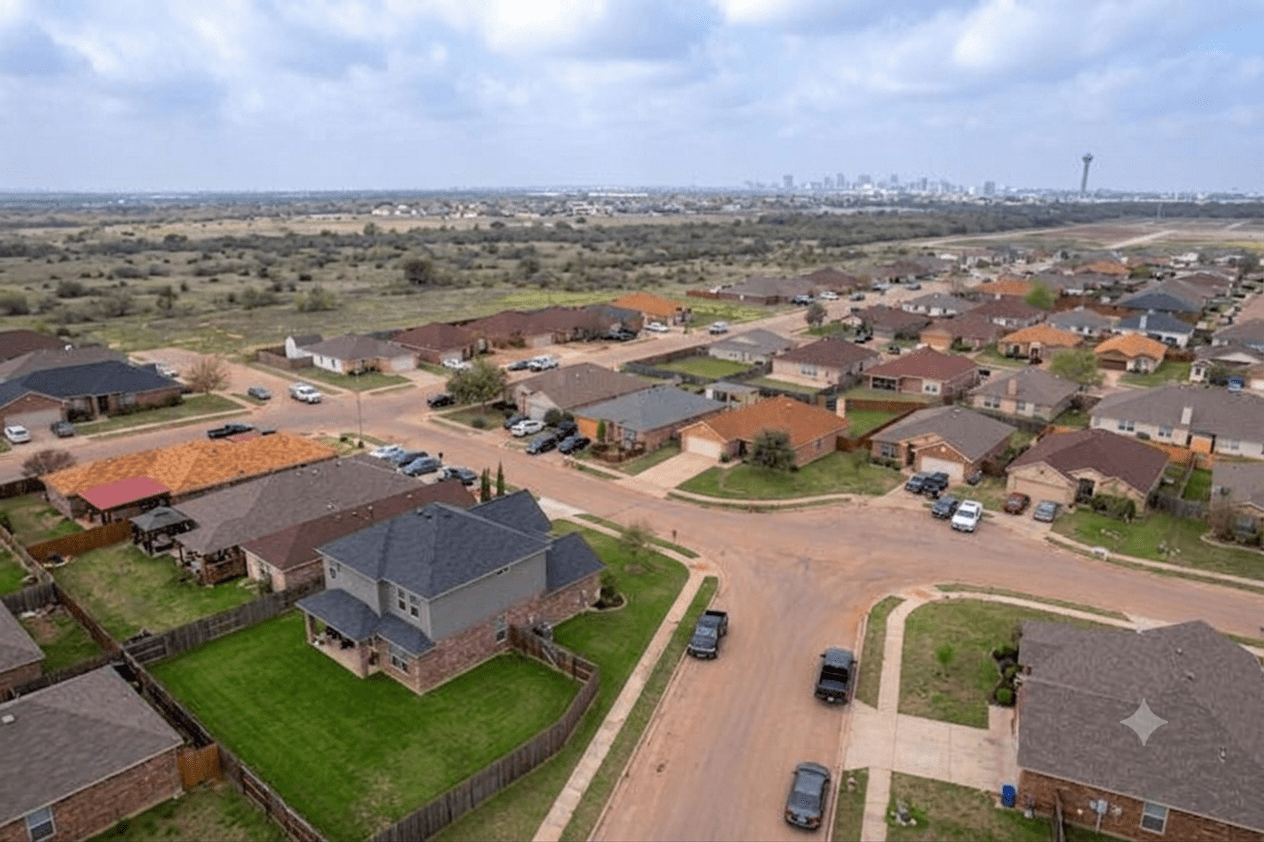
Fort Worth proper carries more genuine character than any city its size in Texas, and buyers who come here for the Stockyards, the Cultural District, and a downtown that people actually walk tend to stop comparing it to Dallas entirely. The city itself spans everything from historic Fairmount bungalows to new construction on the far west side, which means the answer to what Fort Worth costs depends almost entirely on which part of it you mean.

Fort Worth Area

Eight cities. Filter to yours.

The city and the ring around it, running from downtown lofts to acreage in Aledo. Tap what matters to you and the rest will drop away.

Showing all eight cities

Bobby Franklin, REALTOR® · Legacy Realty Group – Leslie Majors Team · northtexasmarketinsider.com

Fort Worth

Find your corner of the map.

Market Snapshot

The Fort Worth Area Housing Market

The four interactive charts below pull live from NTREIS, the same MLS data agents use. Texas is a non-disclosure state, which means most national sites are estimating what these homes actually sold for. These are not estimates. Hover any chart to see the numbers month by month, going back several years.

Median Sales Price

What Homes Actually Sold For

What buyers actually paid, not what sellers hoped to get. Median finds the exact middle of the range, so one outlier sale cannot distort the picture. Sellers: a rising median signals real demand. Buyers: the gap between list and sale price tells you who holds the leverage. The chart below tracks it month by month.

Chart: Median sales price in the Fort Worth area, tracked monthly. Source: NTREIS MLS.
Days On Market

How Fast Homes Are Moving

How long a home sits before going under contract. Under thirty days means multiple offers are common. Over sixty means buyers are selective. Sellers: this sets expectations before you list. Buyers: it tells you whether to decide fast or take your time. The chart below shows the trend.

Chart: Median days on market in the Fort Worth area, tracked monthly. Source: NTREIS MLS.
Shows To Pending

How Many Buyers Walked Through

Showings before a home went under contract, and almost nobody publishes it. Sellers: this is the early warning system. If the area averages eight showings and yours has had fifteen with no offer, the problem is price or presentation. Buyers: a high number means you can be selective. See the chart below.

Chart: Median showings before a home goes pending in the Fort Worth area, tracked monthly. Source: NTREIS MLS.
Percent Of Original Price

Who Is Winning The Negotiation

Final sale price against the original list price, before any reductions. The most honest number here, because it catches the price cuts days on market hides. Sellers: the argument for pricing right the first time. Buyers: how much room your offer actually has. The chart below tracks it.

Chart: Percent of original list price received in the Fort Worth area, tracked monthly. Source: NTREIS MLS.

All four charts update automatically from NTREIS as new sales close. Questions about what any of this means for your situation? Call 214-228-0003.

Bobby Franklin, REALTOR® · Legacy Realty Group – Leslie Majors Team · northtexasmarketinsider.com

Bobby Franklin Realtor®

Bobby Franklin

Realtor®

Serving DFW | Ellis County
16 Northgate Dr. Ste 100

Waxahachie, TX 75165

What's Your Next Strategic Move?

Market Insights | Strategic Planning